
Are you struggling to make sense of your business’s financial statements? You’re not alone. Eight in ten small business owners manage their own business finances, and nearly seven in ten say they wish they knew more about their finances, Intuit reports.
The good news is that you don’t need an accounting degree to understand financial statement basics. We’ll review some standard reports, components of financial statements, and some best practices to help you get started on this page.
What is Financial Statement Analysis?
Financial statement analysis is the process of analyzing documents to improve financial decision-making for businesses, monitor performance, and identify if the business is on track to meet its goals. Each document involved provides unique insights into the financial health of the company.
How Often Should I Review My Financial Statements?
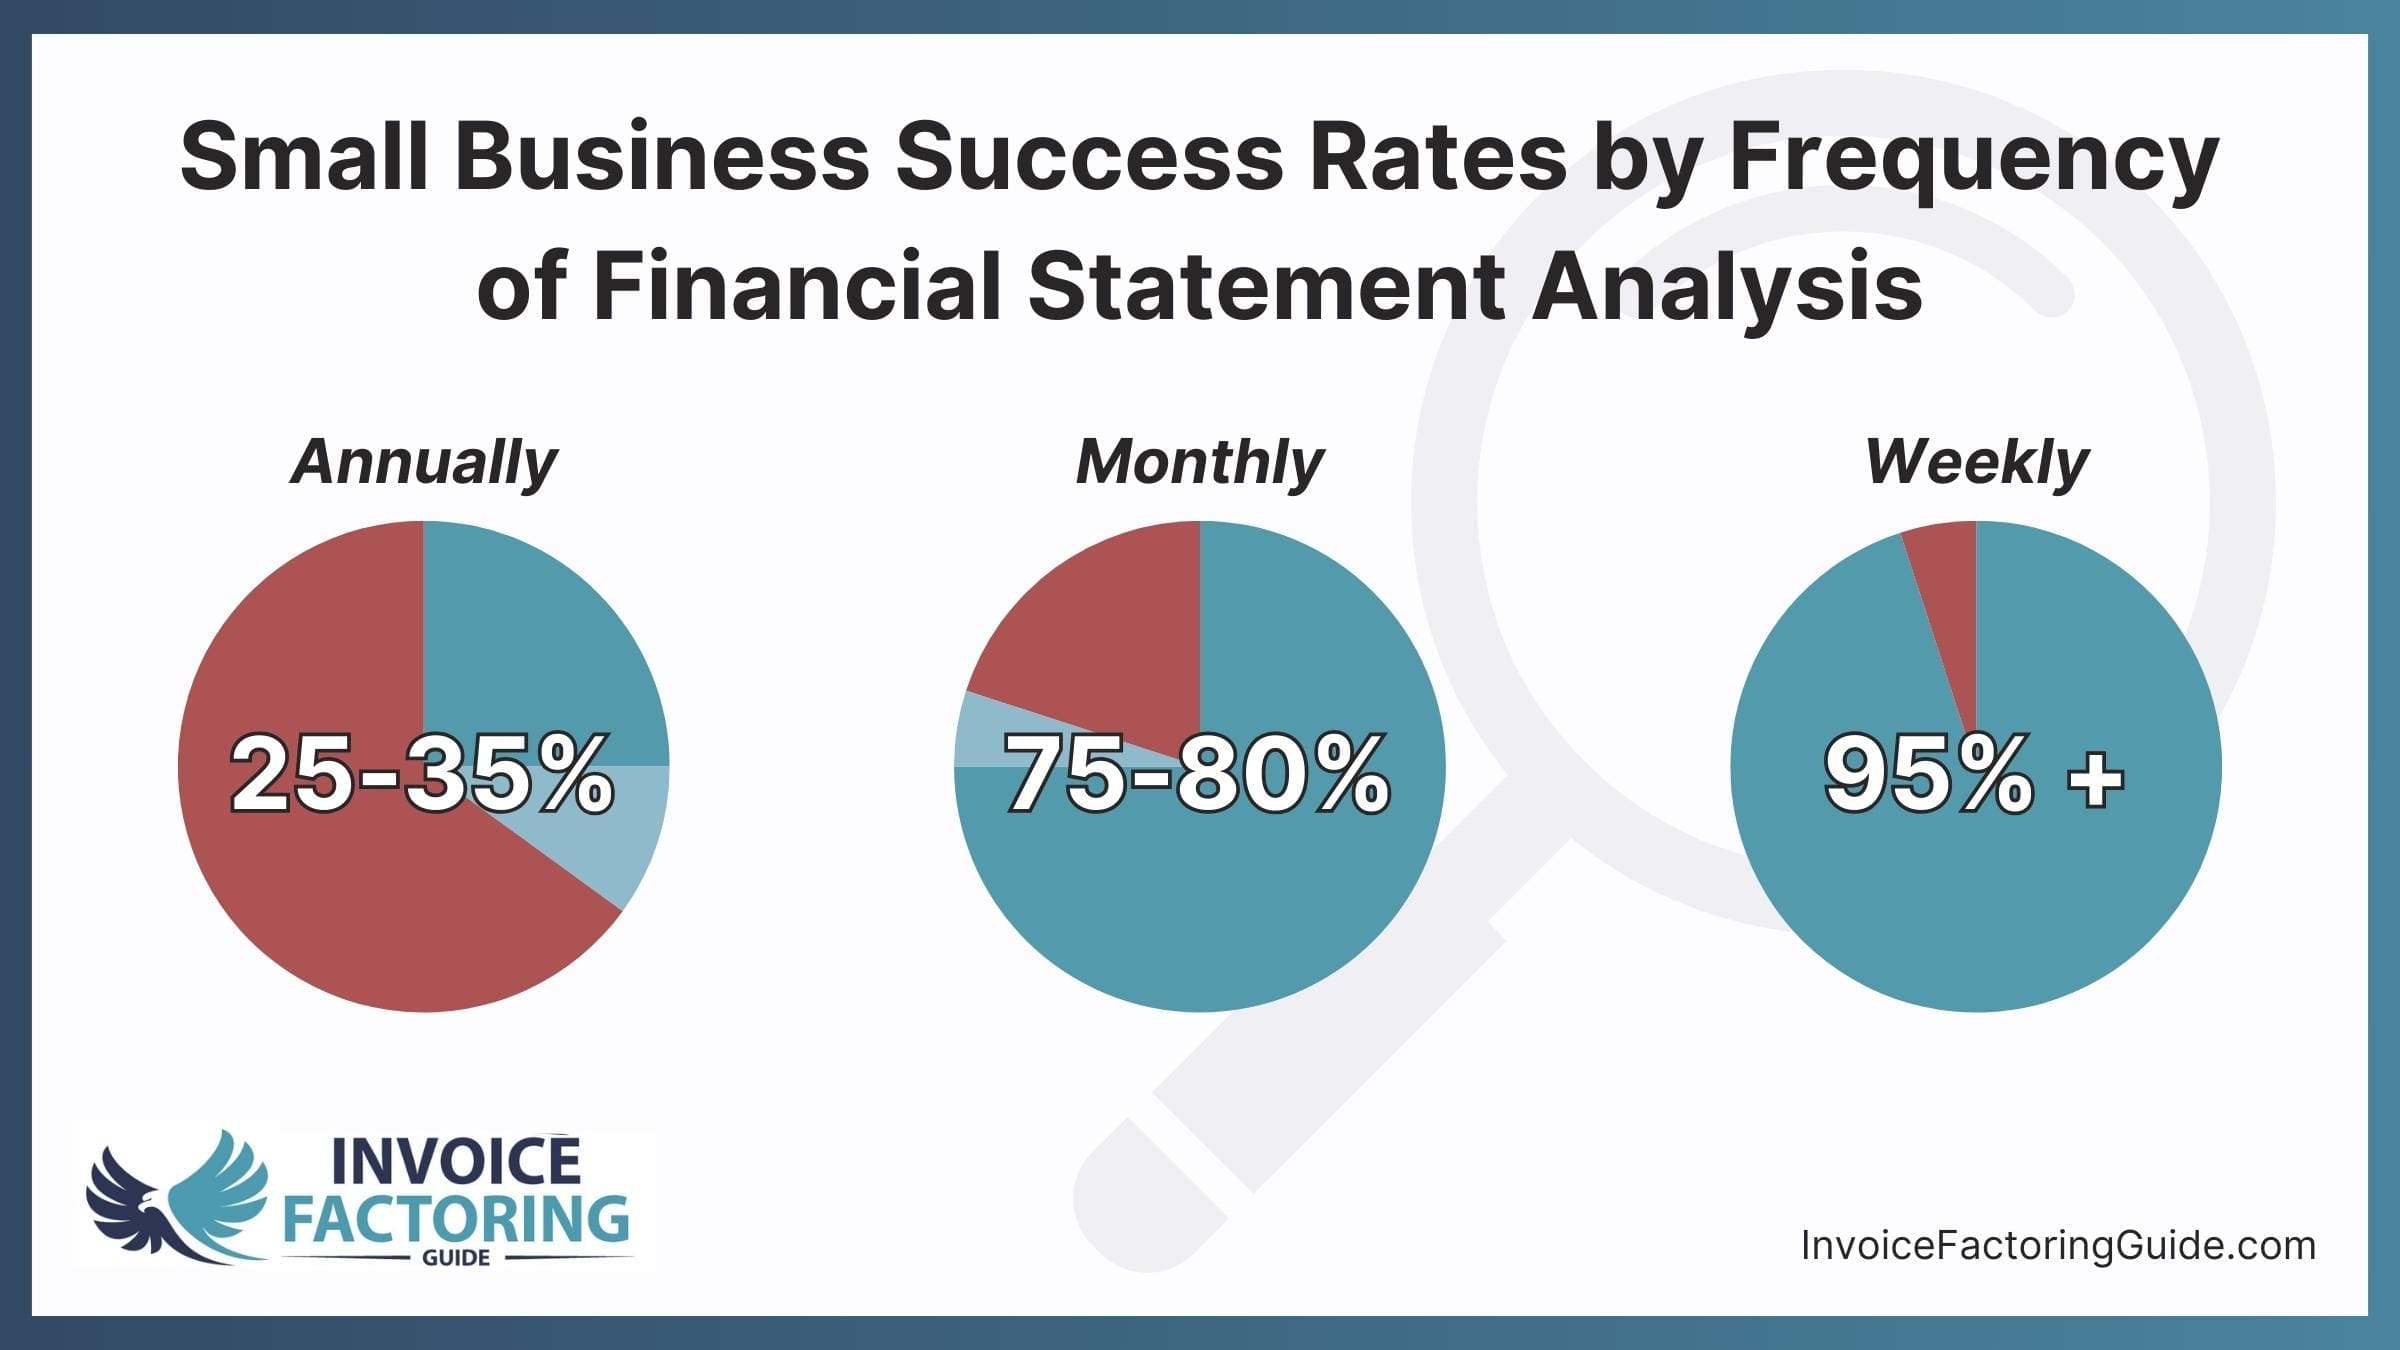
It’s often said that businesses should review their financial statements on a monthly basis. This can help you keep a pulse on your company’s financial health, but it may not be enough. Business success rates increase with the frequency of analysis, Washington SBDC research shows.
- Annual Analysis: 25 to 35 percent success rate
- Monthly Analysis: 75 to 80 percent success rate
- Weekly Analysis: 95+ percent success rate
Common Financial Statements
If you’re using accounting software, you will likely find dozens of different financial reports. Each one gives you a slightly different view of the financial health of your business. Those new to financial statement analysis will likely want to focus on the most common reports, as covered below.
Balance Sheet
Your balance sheet shows what your business owes and owns. The formula typically used on balance sheets is:
Assets = Liabilities + Shareholders’ Equity
- Assets: Anything the business owns that has a quantifiable value, from real estate to equipment and patents.
- Liabilities: Money the business owes to other parties, such as debt payments, outstanding payroll, and taxes.
- Shareholders’ Equity: The amount of money that would be left if all assets were sold and liabilities paid.
Businesses typically use it to determine if they’re putting their cash to work well. A low balance signifies the business should probably be setting aside more cash. A high balance typically means the business should be investing more in itself.
Cash Flow Statement
A cash flow statement (CFS) shows how much money or cash equivalents the business has on hand. It also details where all cash outflows go and where inflows come from. Most are split into three sections: operating activities, investing activities, and financing activities.
- Operating Activities: Cash inflows and outflows generated by the delivery of goods or services.
- Investing Activities: Cash inflows and outflows generated by the purchase or sale of assets.
- Financing Activities: Cash inflows and outflows generated by debt and equity financing.
Businesses often use the CFS to help predict future cash flow for budgeting purposes.
Income Statement
Also known as a profit and loss statement, the income statement shows whether the business gained or lost money after subtracting all expenses. Note that the income statement differs from the cash flow statement because the income statement reflects profitability. The cash flow statement only relates to cash on hand. For example, your business might be profitable, as shown on the income statement, but still have a cash flow shortfall due to things like rapid growth or slow-paying customers. Equally, your business may not be profitable, but you can still have positive cash flow because you’ve taken out a loan or haven’t paid your bills.
The net income statement includes net income, operating expenses, depreciation, and earnings per share (EPS).
- Net Income: Total profit or loss as determined by subtracting expenses from gross revenue.
- Operating Expenses: Every business expense from the reporting period.
- Depreciation: The total loss of asset value during the reporting period.
- Earnings per Share: Net income divided by the total number of outstanding shares.
Accounts Payable (AP) Report
The accounts payable report includes all financial obligations due that must be paid in the short term, such as supplier invoices, contractor payments, and legal fees. You’ll also see AP listed on the balance sheet as a current liability.
Accounts Receivable (AR) Report
Receivables represent a line of credit your business has extended, usually through invoicing clients. Receivables appear on your balance sheet and are considered liquid assets because they can be used to secure funding, such as through invoice factoring.
How to Conduct a Financial Statement Analysis

Financial statements are commonly analyzed in three ways: vertical analysis, horizontal analysis, and ratio analysis.
Vertical Analysis
Vertical analysis is used to review each item, working your way down a single column in a financial statement.
Horizontal Analysis
Also referred to as trend analysis, horizontal analysis involves reading data across the page to compare the same categories for different periods.
Ratio Analysis
A ratio analysis is used when you want to see how one part of a financial report relates to another part of the same report. It’s often used to gauge profitability, liquidity, debt management, and efficiency. We’ll review a few common financial ratios and formulas for calculating them below.
Profitability Ratios
As the name implies, profitability ratios provide insights into how profitable your business is.
- Gross Profit Ratio: Gross Margin = (Revenue – Cost of Goods Sold) ÷ Revenue
- Return on Equity: Return on Equity = Net Income – Shareholders’ Equity
- Break-Even Point: Break-Even Point (Sales Dollars) = Fixed Costs ÷ Contribution Margin
- Return on Net Assets (RONA) Ratio: RONA = Net Profit ÷ (Fixed Assets + Net Working Capital)
Liquidity Ratios
Liquidity refers to your company’s ability to convert assets into cash. It demonstrates your ability to pay off liabilities due within a year, also called short-term liabilities.
- Cash Coverage Ratio: Cash Coverage Ratio = (Earnings Before Interest and Taxes + Depreciation Expenses) ÷ Interest expenses
- Current Ratio/ Working Capital Ratio: Current Ratio = Current Assets ÷ Current Liabilities
- Liquidity Ratio: Liquidity Ratio = (Current Assets + Long-Term Assets) ÷ (Current Liabilities + Long-Term Liabilities)
Leverage Ratios
Leverage ratios are used to show how much your business depends on debt to maintain operations.
- Debt to Equity Ratio (D/E): Debt to Equity Ratio = Total Debt ÷ Total Shareholders’ Equity
- Debt Service Coverage Ratio (DSCR): DSCR = Net Operating Income ÷ Total Debt Service
- Fixed Charge Coverage Ratio (FCCR): FCCR = (Earnings Before Interest and Taxes + Fixed Charges Before Taxes) ÷ (Fixed Charges Before Taxes + Interest)
Activity Ratios
Activity ratios can help you understand how well your business is leveraging resources.
- Accounts Payable (AP) Turnover Ratio: AP Turnover Ratio = Total Purchases ÷ Accounts Payable Balance
- Accounts Receivable (AR) Turnover Ratio: AR Turnover Ratio = Net Sales ÷ Average Account Receivables
- Inventory Turnover Ratio: Inventory Turnover Ratio = Cost of Goods Sold ÷ Average Value of Inventory
- Working Capital Turnover Rate: Working Capital Turnover Ratio = Net Annual Sales ÷ Average Working Capital
What to Look for During a Financial Statement Analysis
Working with your accountant and bookkeeper is always a good idea to better understand how your business normally behaves and what industry benchmarks look like. However, there are some red flags to keep an eye out for.
Large Unexplained Expenses on the Balance Sheet
Expenses that don’t fit into main categories typically get filed as “other expenses” on your balance sheet. It’s somewhat common to see small expenses listed this way. However, you should always investigate large expenses to see what they are and if they’re likely to appear again later.
Downward Trending Revenue
Most businesses see some seasonal revenue shifts. However, if your downward trend continues when you’d normally see an uptick or revenue declines year-on-year, it’s crucial to identify and address the underlying causes. In the meantime, you’ll likely want to find ways to reduce costs to help offset the difference.
Rising Debt to Equity Ratio
A rising D/E could signify that your business is taking on more debt than it can handle. Investigate the causes and see if there are ways to reduce debt quickly.
Insufficient Cash Flow
If your CFS shows that you don’t have much breathing room or that your outflows exceed your inflows, you’re likely to hit a point where your business cannot pay its bills, even if it’s profitable. Identify ways to increase or accelerate your inflows and slow or reduce your outflows.
Boost Your Cash Flow with Invoice Factoring
Invoice factoring provides instant payment on your B2B invoices, solving issues like insufficient cash flow and making cash flow more predictable so it’s easier to budget. It’s also a form of debt-free funding, which keeps your D/E ratio lower. If your business sometimes struggles with cash flow gaps or has trouble ramping up for busy seasons, invoice factoring can help. Request a complimentary factoring rate quote to learn more or get started.
FAQs About Financial Statement Analysis
What is the difference between reading financial statements and analyzing them?
Reading financial statements means reviewing the numbers as they appear. Analyzing them means evaluating what those numbers indicate about a company's financial performance, how they compare to prior periods or industry benchmarks, and what they suggest about future outcomes. Analysis goes beyond the line item level to identify trends, assess financial stability, and inform business decisions. It is this interpretive layer that gives financial statement analysis its real value.
What is DuPont analysis and when should a business use it?
DuPont analysis is a method of breaking down return on equity into its component parts to identify what is driving financial performance. It separates profitability, asset efficiency, and financial leverage into distinct metrics, allowing business leaders to pinpoint exactly where performance is strong or where it is falling short. It is particularly useful when a business wants to understand a company's financial statements in more detail than a standard ratio analysis provides.
What is free cash flow and why does it matter in financial analysis?
Free cash flow represents the cash a company generates after accounting for capital expenditures. It is a key financial metric because it shows how much cash is genuinely available for growth, debt repayment, or distribution to stakeholders after the business has maintained or expanded its asset base. Unlike net income, free cash flow reflects actual liquidity, making it a reliable indicator of overall financial health when evaluating a company's financial position.
How can financial statement analysis help a business decide whether to use invoice factoring?
Reviewing your statement of cash flows and accounts receivable report can reveal whether slow-paying customers are creating cash flow gaps despite the business being profitable. If your analysis shows that outflows consistently exceed inflows during certain periods, or that receivables are taking too long to convert to cash, invoice factoring may be worth considering. It converts unpaid invoices into immediate working capital without adding debt, which also helps keep leverage ratios in check.
This article is for educational purposes only and does not constitute business, financial, legal, or tax advice. Speak with a qualified professional about your specific circumstances before making business, financial, legal, or tax decisions.

About Invoice Factoring Guide
 DIP Financing vs. Invoice Factoring: A Detailed Comparison
 9 Tips for Preparing for Your Fiscal New Year
Related Insights


Get an instant funding estimate
Results are estimates based on the calculated rate and the total invoice amount provided.
Actual rates may vary.
Request a Factoring Rate Quote
PREFER TO TALK? Call us at 1-844-887-0300
")